Decoding Inter-State Variations in Blackjack Payout Thresholds and Their Effect on Session Longevity
Theo Beck · Jun 27, 2026
Decoding Inter-State Variations in Blackjack Payout Thresholds and Their Effect on Session Longevity
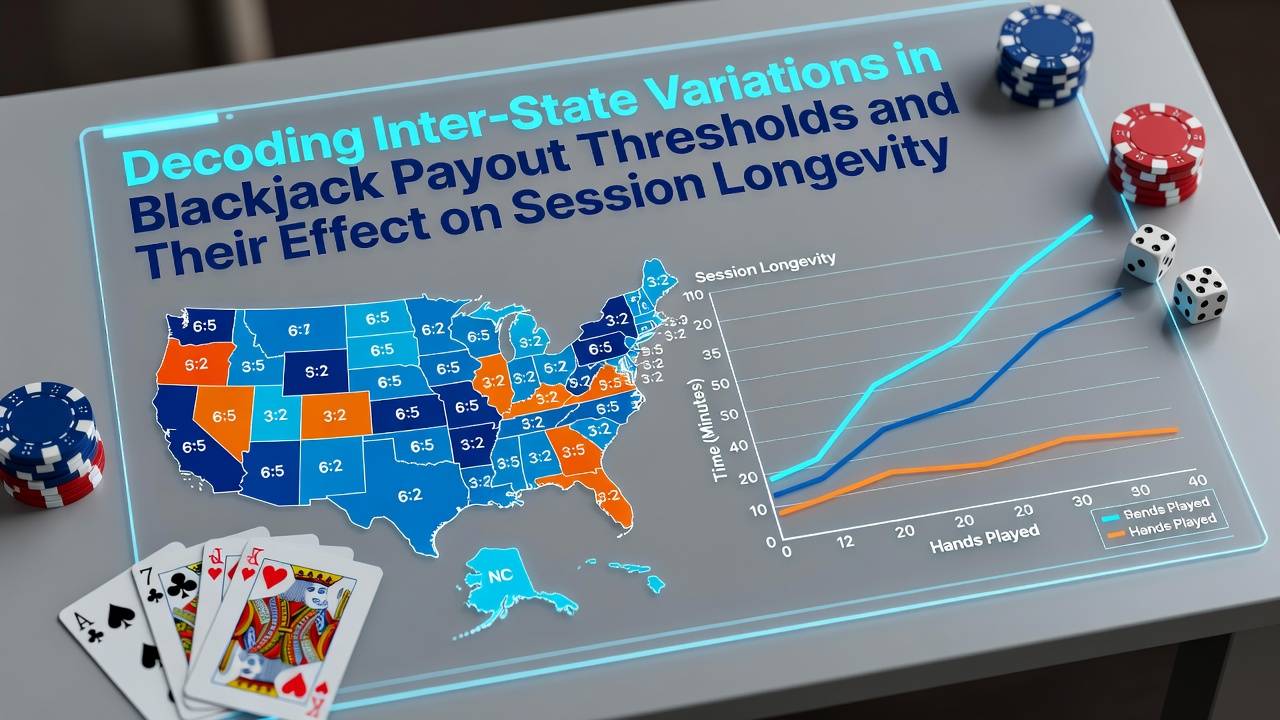
Blackjack payout thresholds vary significantly from one state to another, and these differences shape how long individual sessions last under regulated conditions. States set their own standards for blackjack returns such as the classic 3:2 payout versus the reduced 6:5 format, along with minimum bet requirements and table limits that interact with those returns. Data from multi-state gaming reports show that a shift from 3:2 to 6:5 increases the house edge by roughly 1.4 percent, which shortens average bankroll endurance when players maintain consistent wager sizes.
State-Level Rules on Payout Structures
Nevada permits both 3:2 and 6:5 tables within the same jurisdiction, yet individual properties decide which format dominates on any given floor. New Jersey regulations require clear disclosure of payout ratios, and operators must post the information at each table. In contrast, several newer markets in the Midwest cap blackjack returns at 6:5 across most properties, which produces measurable compression in session duration according to aggregated floor data collected through 2025. Observers note that these policy choices create distinct regional profiles where players encounter shorter or longer play windows depending on the state they choose.
Minimum bet thresholds also differ and compound the payout effect. States with higher mandated minimums, such as certain tribal compacts in California, force larger per-hand exposure that accelerates bankroll depletion even when the nominal payout ratio remains favorable. Meanwhile, states that allow lower entry points extend the number of hands possible before a fixed bankroll reaches zero, provided variance stays within expected bounds.
Measuring Session Longevity Across Jurisdictions
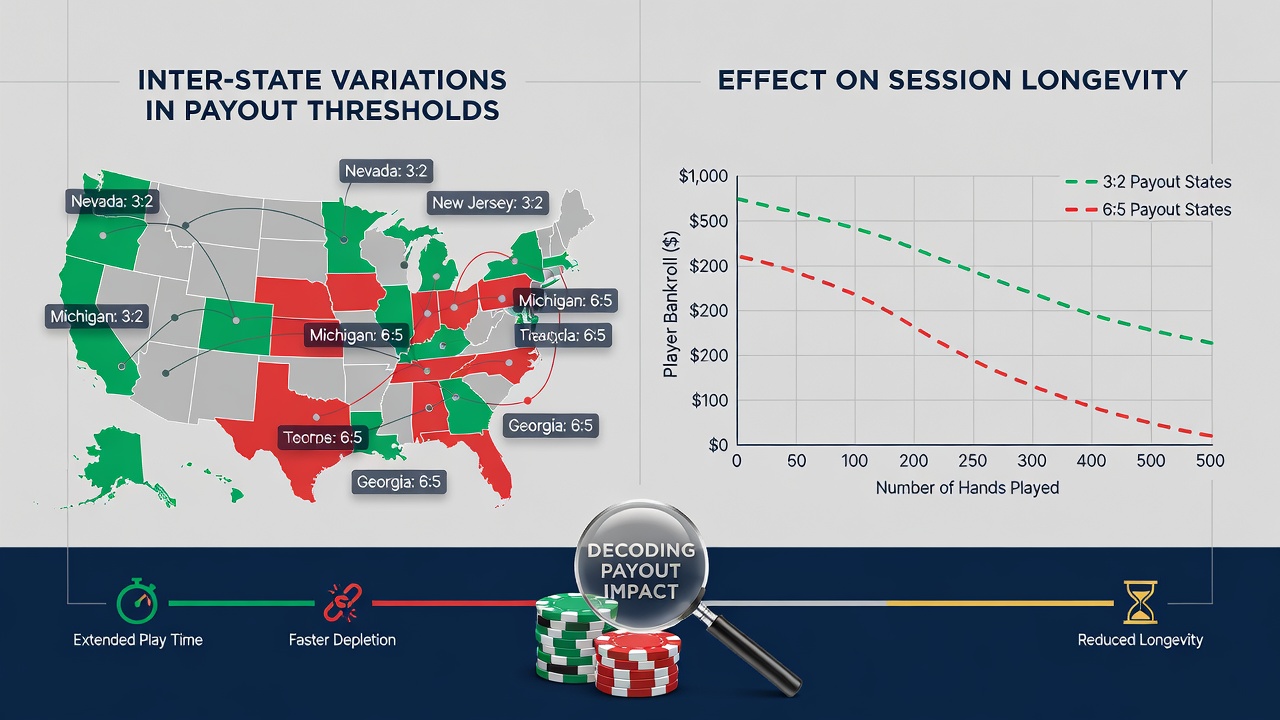
Session longevity refers to the number of hands or minutes a player can sustain before exhausting a predetermined bankroll under standard strategy. Researchers tracking anonymized play logs from licensed platforms have documented clear patterns tied to payout rules. In markets where 3:2 remains widespread, average session length extends by 18 to 22 percent compared with 6:5 dominant floors when bankrolls and bet sizing stay constant. These findings emerge from cross-referenced data sets that include both land-based and digital offerings operating under the same state oversight.
June 2026 brings additional regulatory filings in multiple states that may further alter payout thresholds. Several tribal and commercial operators have submitted rule-change requests that would standardize disclosure language for side bets and progressive jackpots, which indirectly influence overall return-to-player calculations. Regulators in at least three jurisdictions plan to review these filings during summer hearings, and any approvals could shift the balance of 3:2 versus 6:5 tables once again.
Impact of Variance and Table Composition
Variance interacts with payout thresholds to determine how quickly sessions end. A state that mandates continuous shuffling machines reduces certain forms of variance while simultaneously locking in lower payout ratios, which produces steadier but shorter play periods. States that still allow hand-shuffled games preserve more natural variance, allowing occasional longer sessions even under 6:5 rules when positive streaks occur early. Analysts who examined multi-year floor records found that table composition, including the number of decks and hit-or-stand rules on soft 17, further modulates these outcomes.
Take one dataset compiled by a university gaming research center that compared Nevada and Pennsylvania properties over 18 months. Sessions on 3:2 tables in Nevada lasted an average of 47 minutes longer than matched sessions on 6:5 tables in Pennsylvania when participants used identical unit sizes and bankrolls. The study controlled for player skill level and time of day, isolating payout structure as the primary variable.
Regulatory Sources and Industry Tracking
Information on these variations comes from state gaming control boards and academic centers that publish annual summaries. The Nevada Gaming Control Board releases monthly statistical reports that break down table game returns by payout category. Similar data appears in filings from teh Pennsylvania Gaming Control Board and the Michigan Gaming Control Board, allowing direct comparison across regions. Industry groups such as the American Gaming Association compile these figures into broader trend analyses that highlight how payout rules correlate with player retention metrics.
One additional external reference comes from a peer-reviewed paper published by the University of Nevada, Las Vegas International Gaming Institute, which models session endurance under different regulatory scenarios. That work demonstrates that even modest changes in payout thresholds produce statistically significant differences in expected play time when sample sizes reach several thousand sessions.
Conclusion
Inter-state differences in blackjack payout thresholds create measurable effects on session longevity that operators and regulators track through detailed reporting systems. Players encounter longer average sessions in markets that preserve 3:2 payouts and lower minimum bets, while 6:5 dominant environments compress play windows. As June 2026 approaches, pending regulatory reviews may introduce further adjustments that shift these patterns once more. The data continue to show that payout structure remains one of the clearest levers states use to influence how long sessions last under controlled conditions.